Targeting rules suggest the values your SDKs have actually sent. When one service sends tier as gold and another as Gold, you get two suggestions and a rule that misses half your users, and until now there was no way to see it. The new User Contexts tab on every project shows each identified user with the attributes last sent, lists every distinct value per attribute, and lets you remove a bad one in a single step.
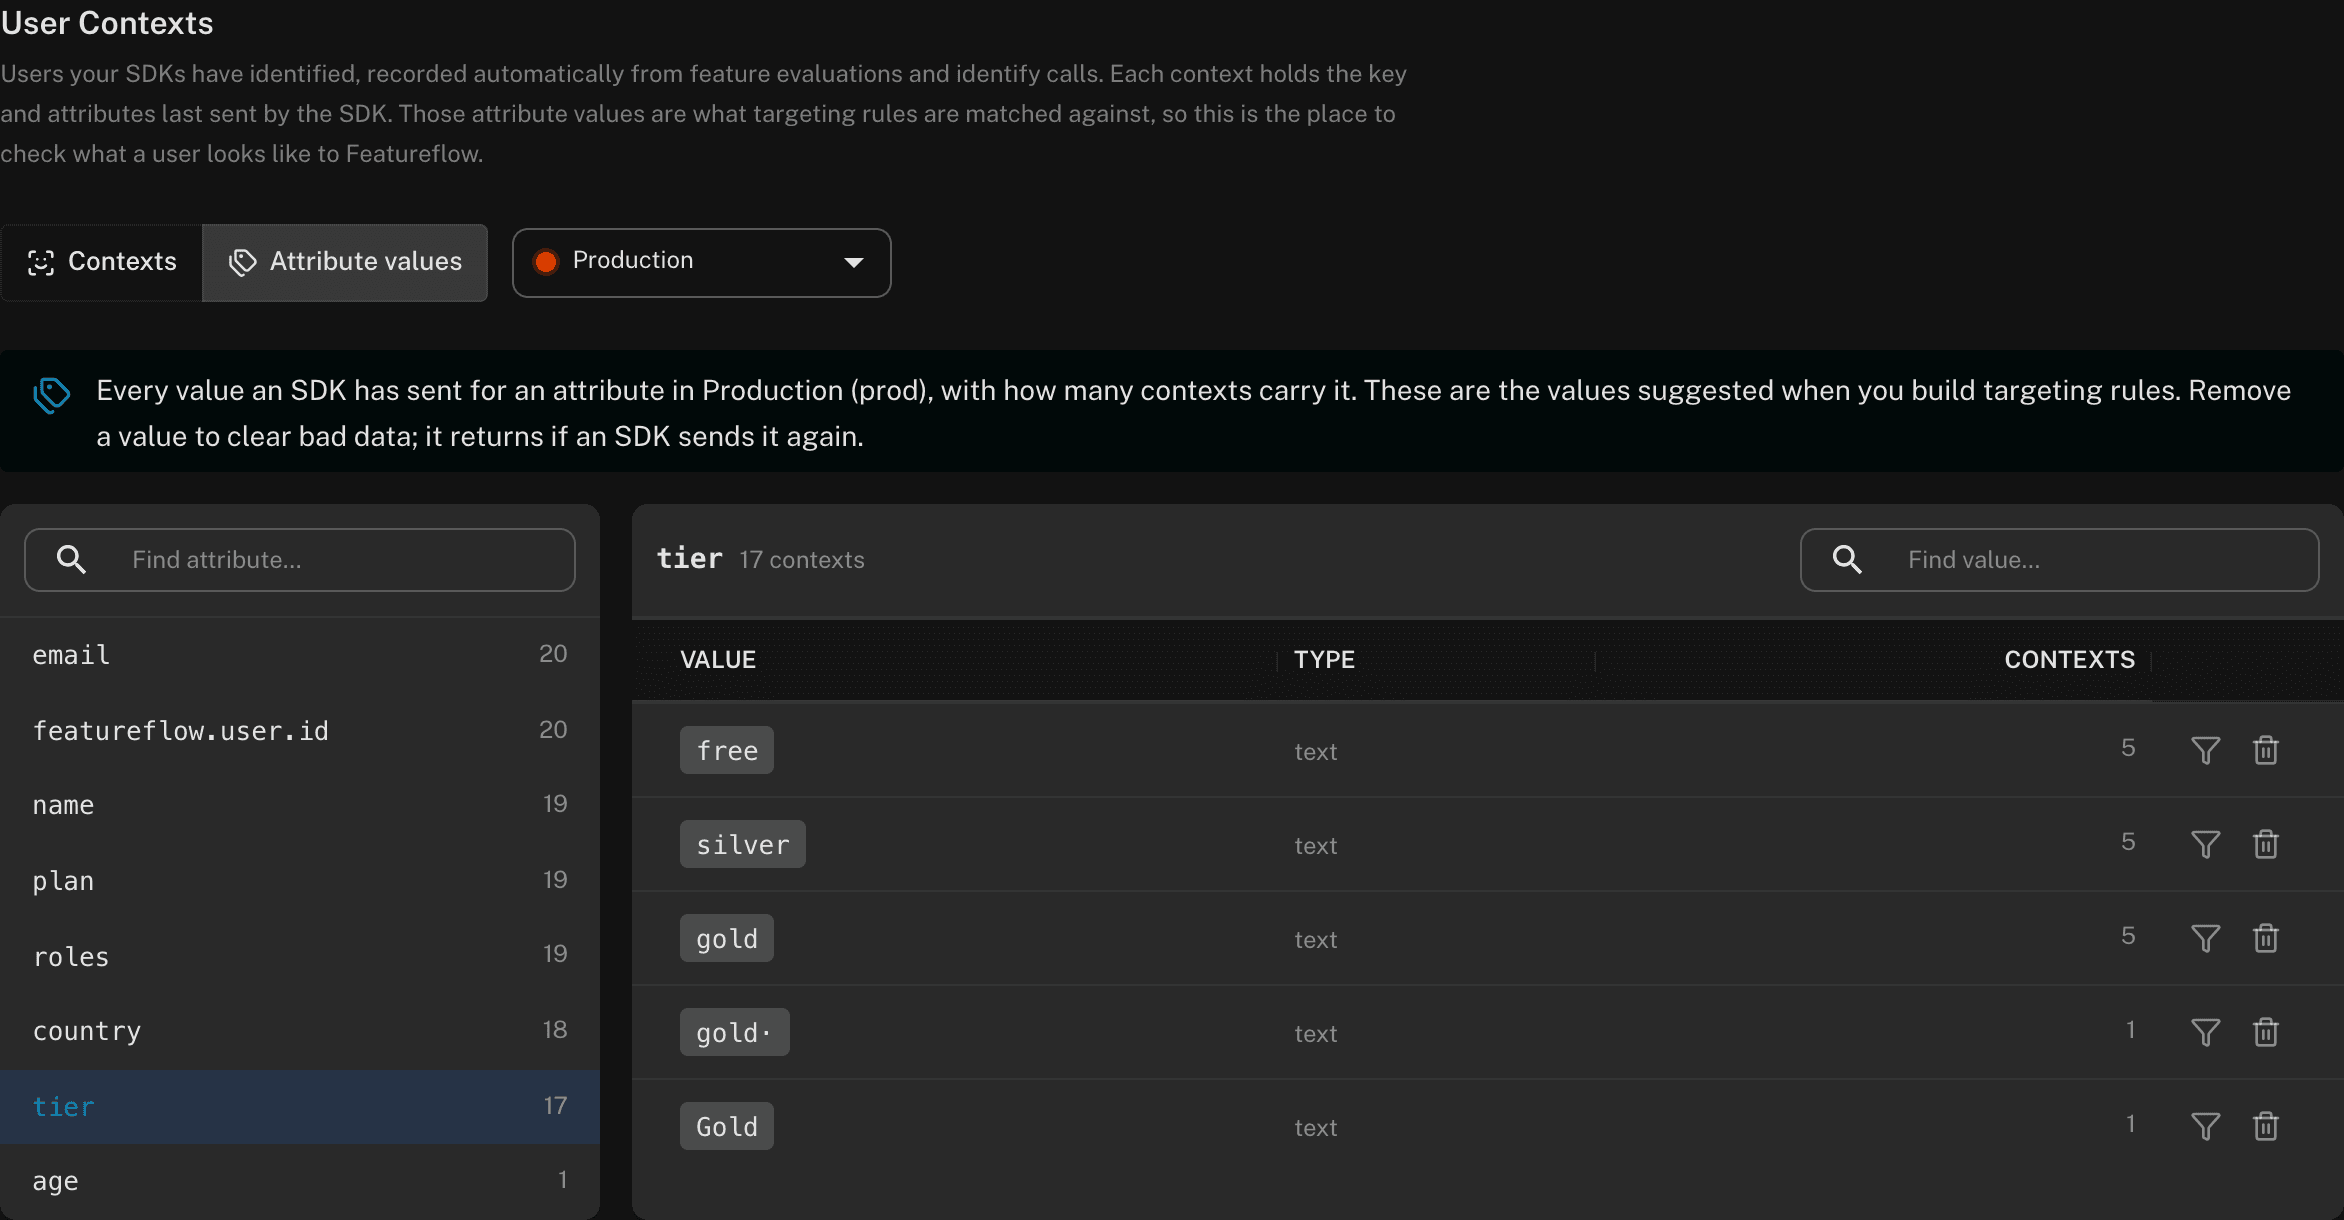
Every user your SDKs have identified, per environment, with the attributes last sent and when they were last seen
Sort by key, kind or last seen, and filter to the users where an attribute equals a value
Attribute values view: each distinct value with its type and how many users carry it, so Gold, GOLD and gold with a trailing space stand out next to gold
Remove a bad value from every user in an environment, and it drops out of targeting suggestions
A removed value comes back if an SDK sends it again, so the app and the docs both point you at the identify call to fix
The Amplitude integration is now the general case. The JavaScript SDK's new exposureIntegration sends flag exposures to any analytics tool through that tool's own SDK — you write the event, Featureflow handles the deduping and which flags send — and there is a copy-paste recipe for each tool's native experiment report.
exposureIntegration(send, { flags }) in featureflow-client 2.6.0 and react-featureflow-client 2.6.0
Recipes for Mixpanel ($experiment_started), PostHog ($feature_flag_called), Segment (Experiment Viewed) and GA4 (event plus user property), each verified against the tool's experiment conventions
Exposures go through your own analytics SDK — your user identity, no id mapping, no data through third parties
Deduped per user, flag and variant, so a flag evaluated on every render sends one event
Limit exposures to the flags you are experimenting with, by key or by naming convention
amplitudeIntegration is unchanged — it is now built on the same adapter
Promoting a release, repointing an SDK key or retiring an environment all hinge on one question: would these two environments evaluate the same? Every feature is now listed side by side with exactly what differs, and you can copy targeting from one environment to the other in a single, gated step.
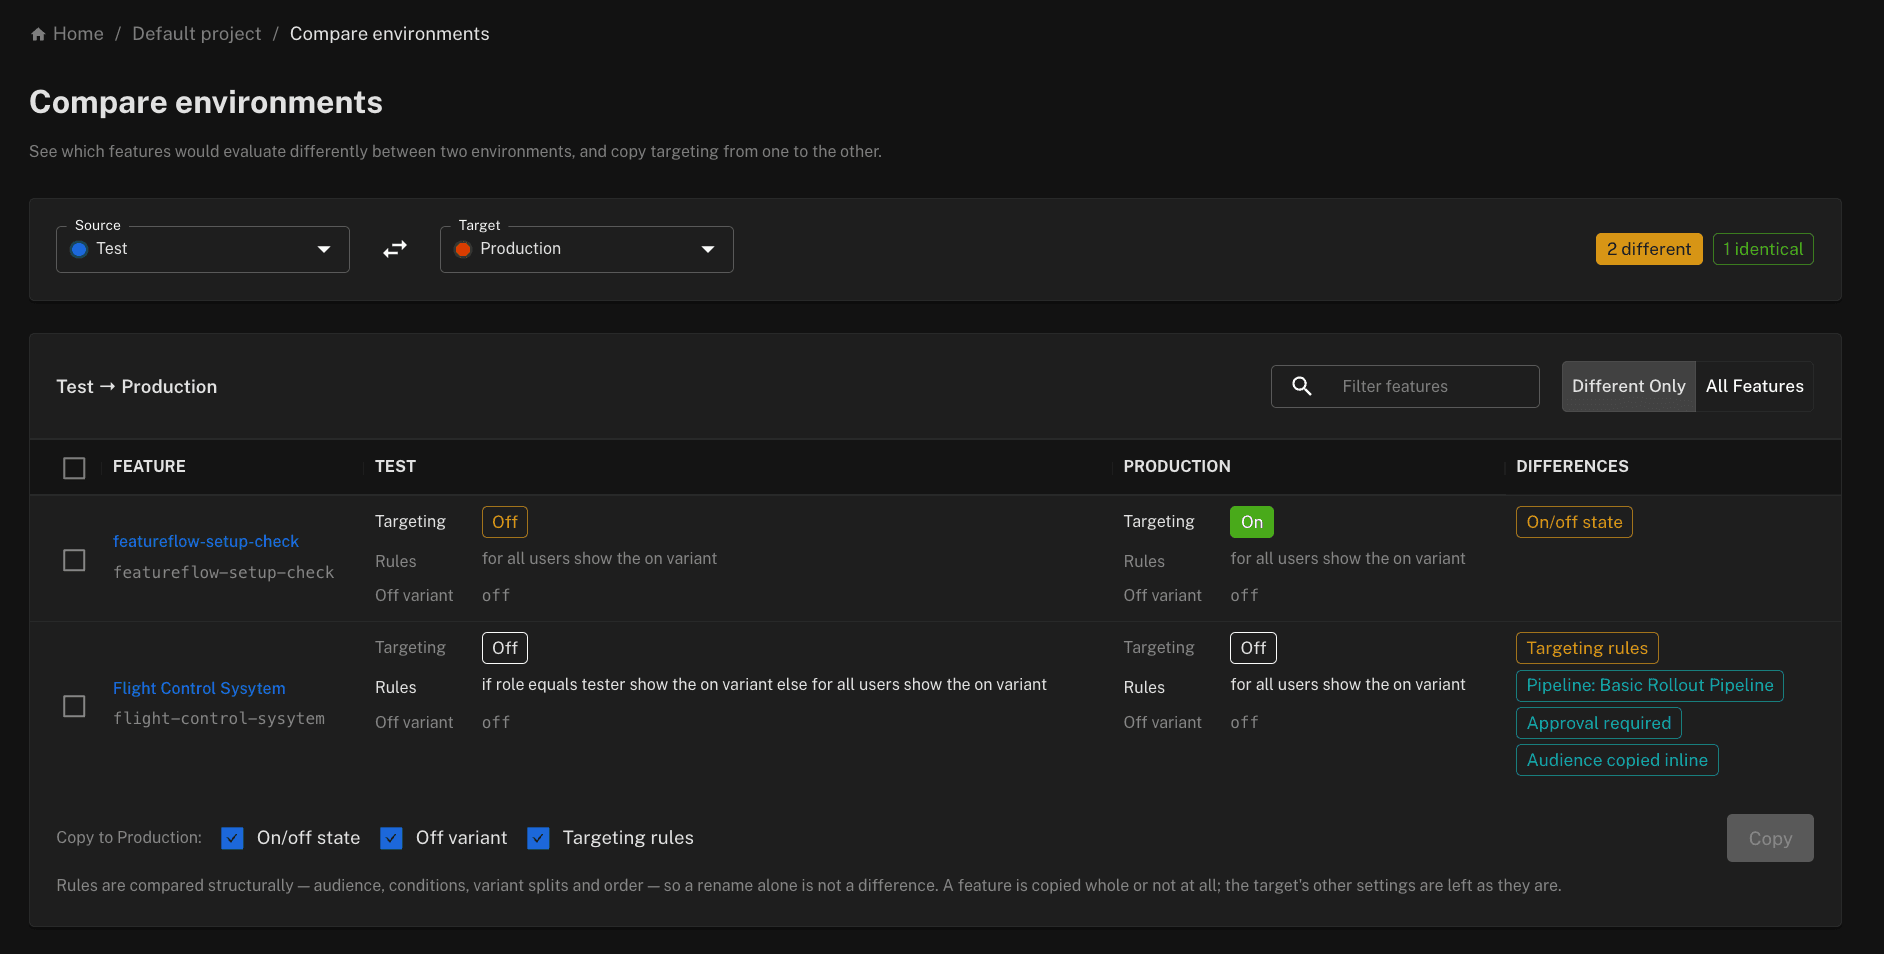
Pick a source and a target; each feature shows its targeting state, rules and off variant in both, with the differing parts called out
Rules are compared structurally — audience conditions, variant splits and order — so a renamed rule is not a difference
Rules stay visible when targeting is off, because they apply the moment it is switched on
Tick the features, choose which settings to copy (on/off state, off variant, targeting rules) and confirm
Same guardrails as editing directly: production editor role for production targets, approval requests where the environment, feature or pipeline phase requires them
An audience specific to the source environment is copied as inline conditions, so the target evaluates the same
Pipeline-managed features are flagged before you copy — a copy sets targeting directly and does not advance the pipeline
Also over the REST API: GET …/environments/compare and POST …/environments/copy, reporting each feature as applied, held for approval or skipped
Deleting or repointing an environment used to mean guessing whether some service was still reading flags from it. Every environment now shows when an SDK last connected and which one it was — and the delete dialog tells you before you confirm, not after something goes dark.
Last SDK connection on every environment: Active (within 7 days), Idle (within 90), Inactive, or no connection ever
Recorded on every authenticated SDK request, including configuration polls — an instance that never reports events still shows up
Shows the SDK that last connected (for example NodeJsClient/0.9.0) and whether it used a server or client key
Delete-environment dialog flags an environment contacted in the last week in red, and confirms in green when nothing was ever recorded
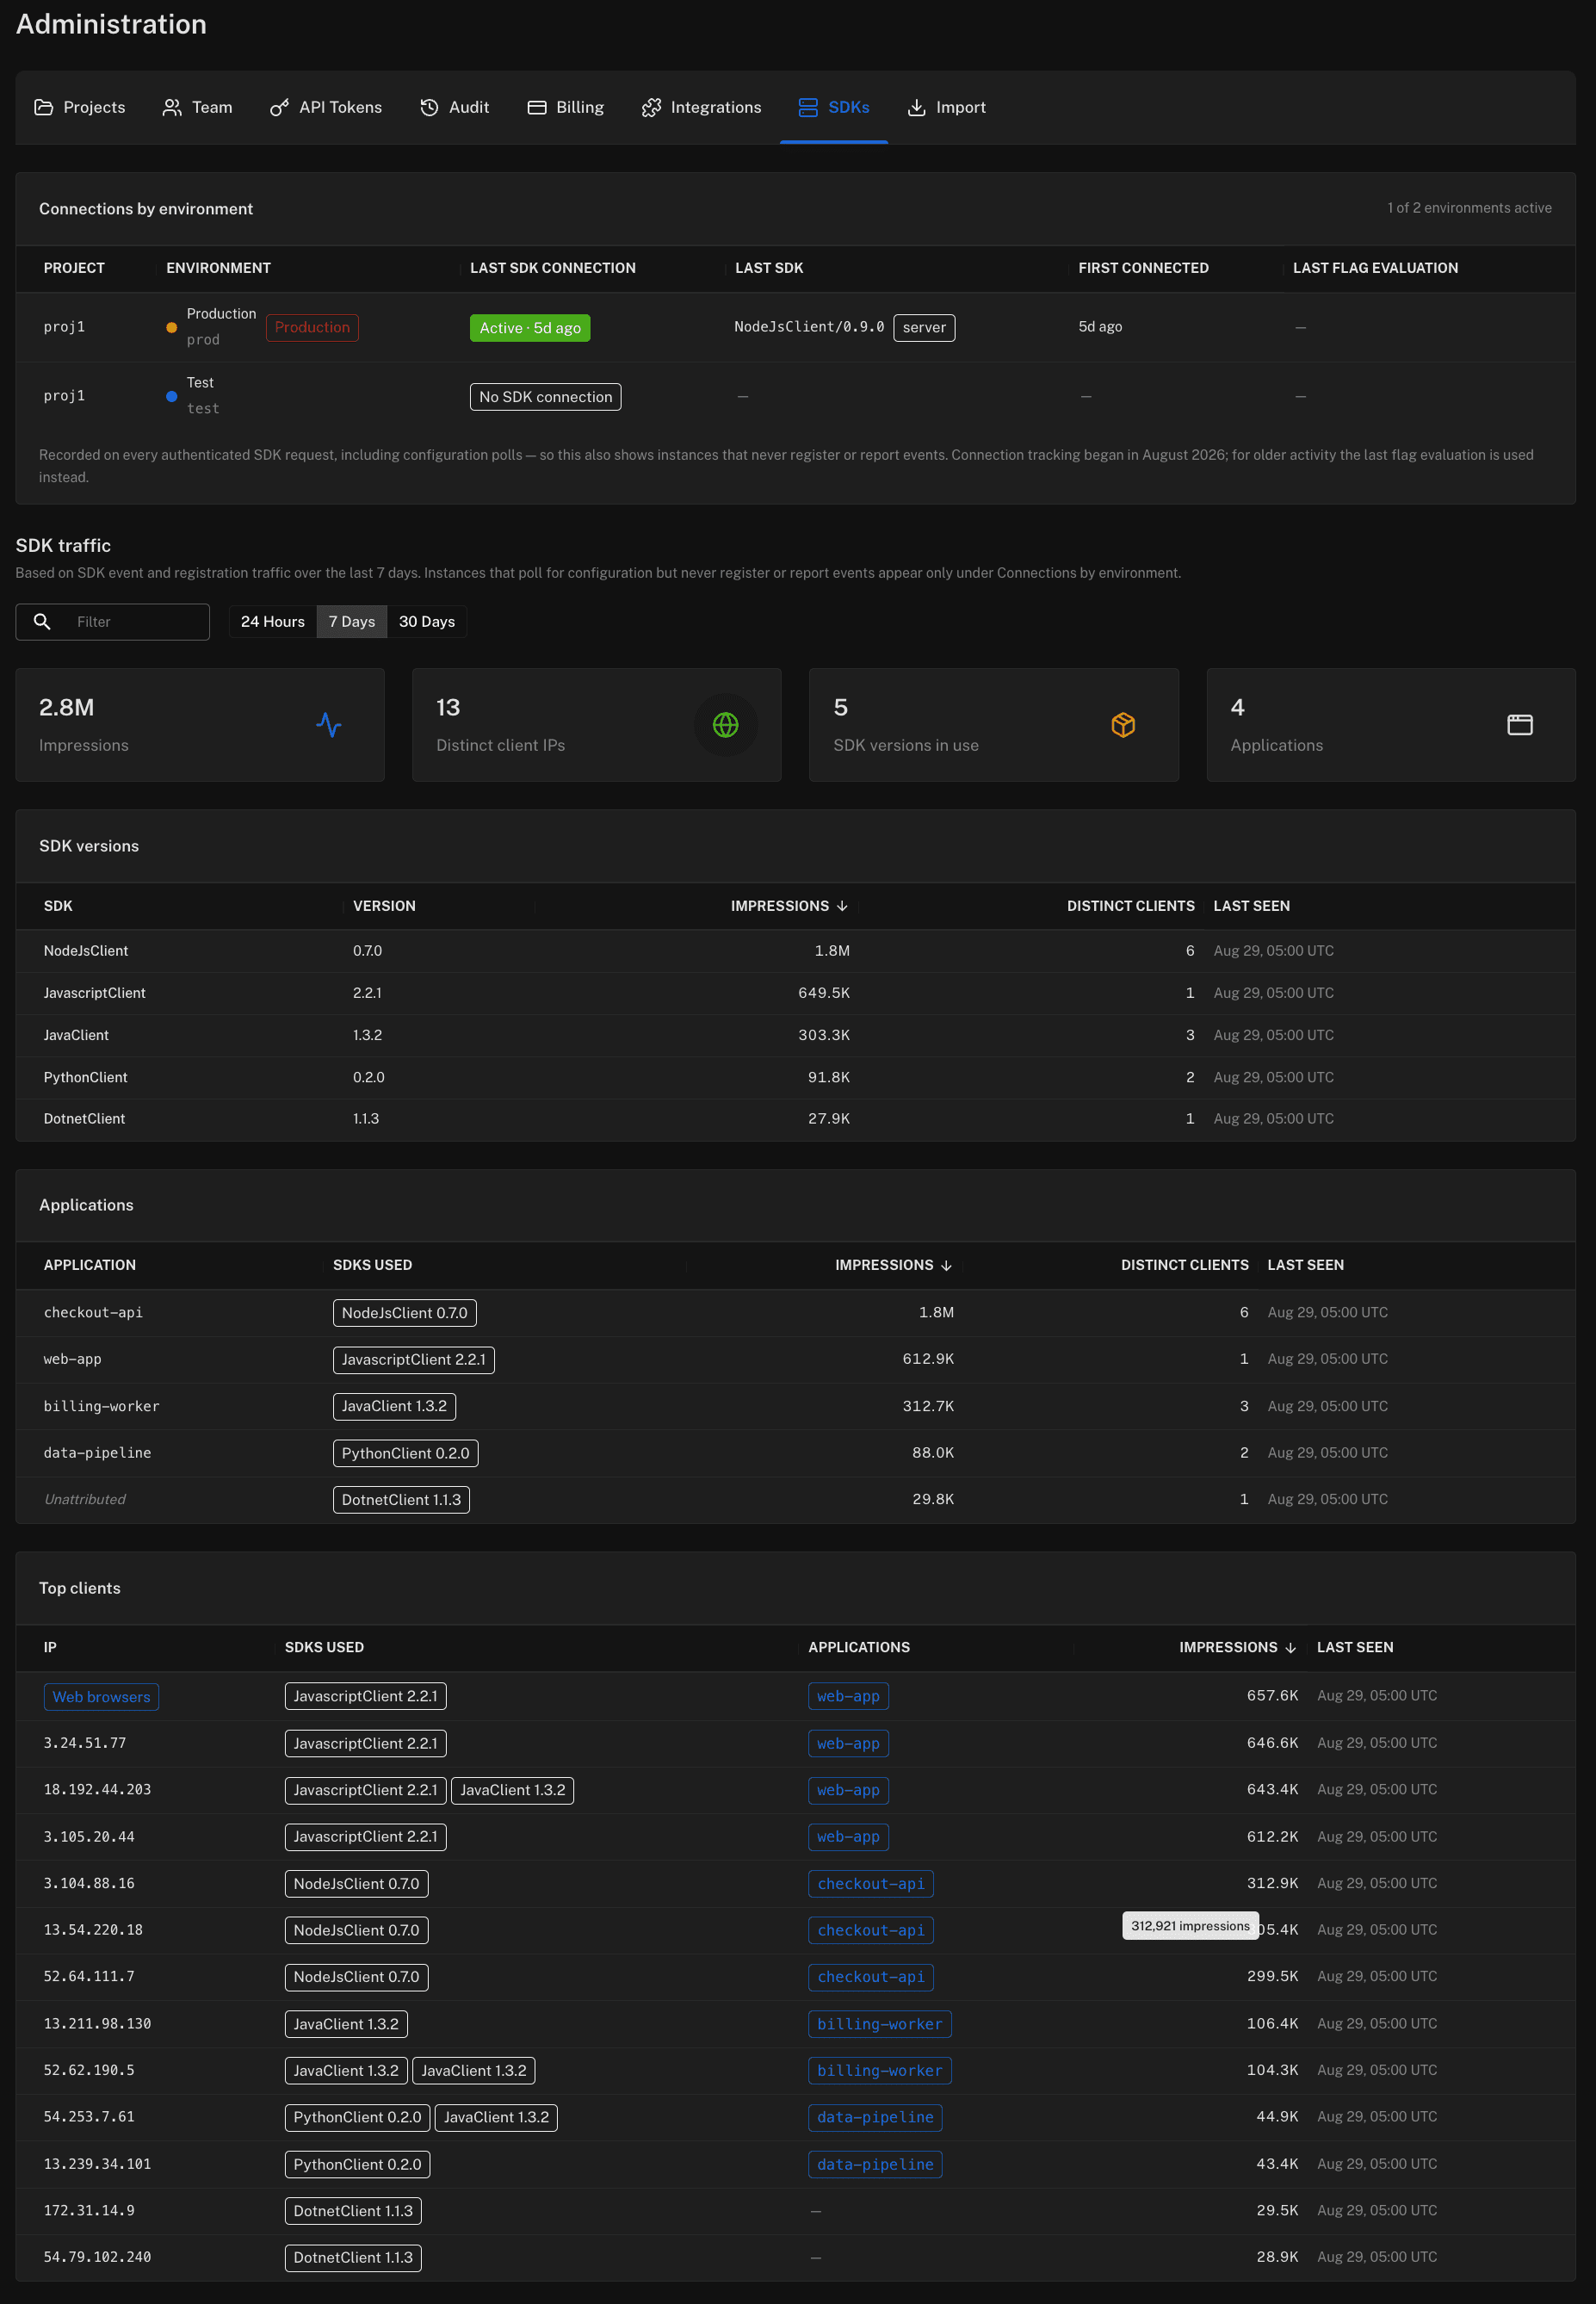
Admin → SDKs opens with Connections by environment across all your projects, most recently contacted first
Same data over the REST API: GET /api/v1/environments/usage — per environment, with the source of the evidence
Connection tracking began in August 2026; for older activity the last flag evaluation is used instead
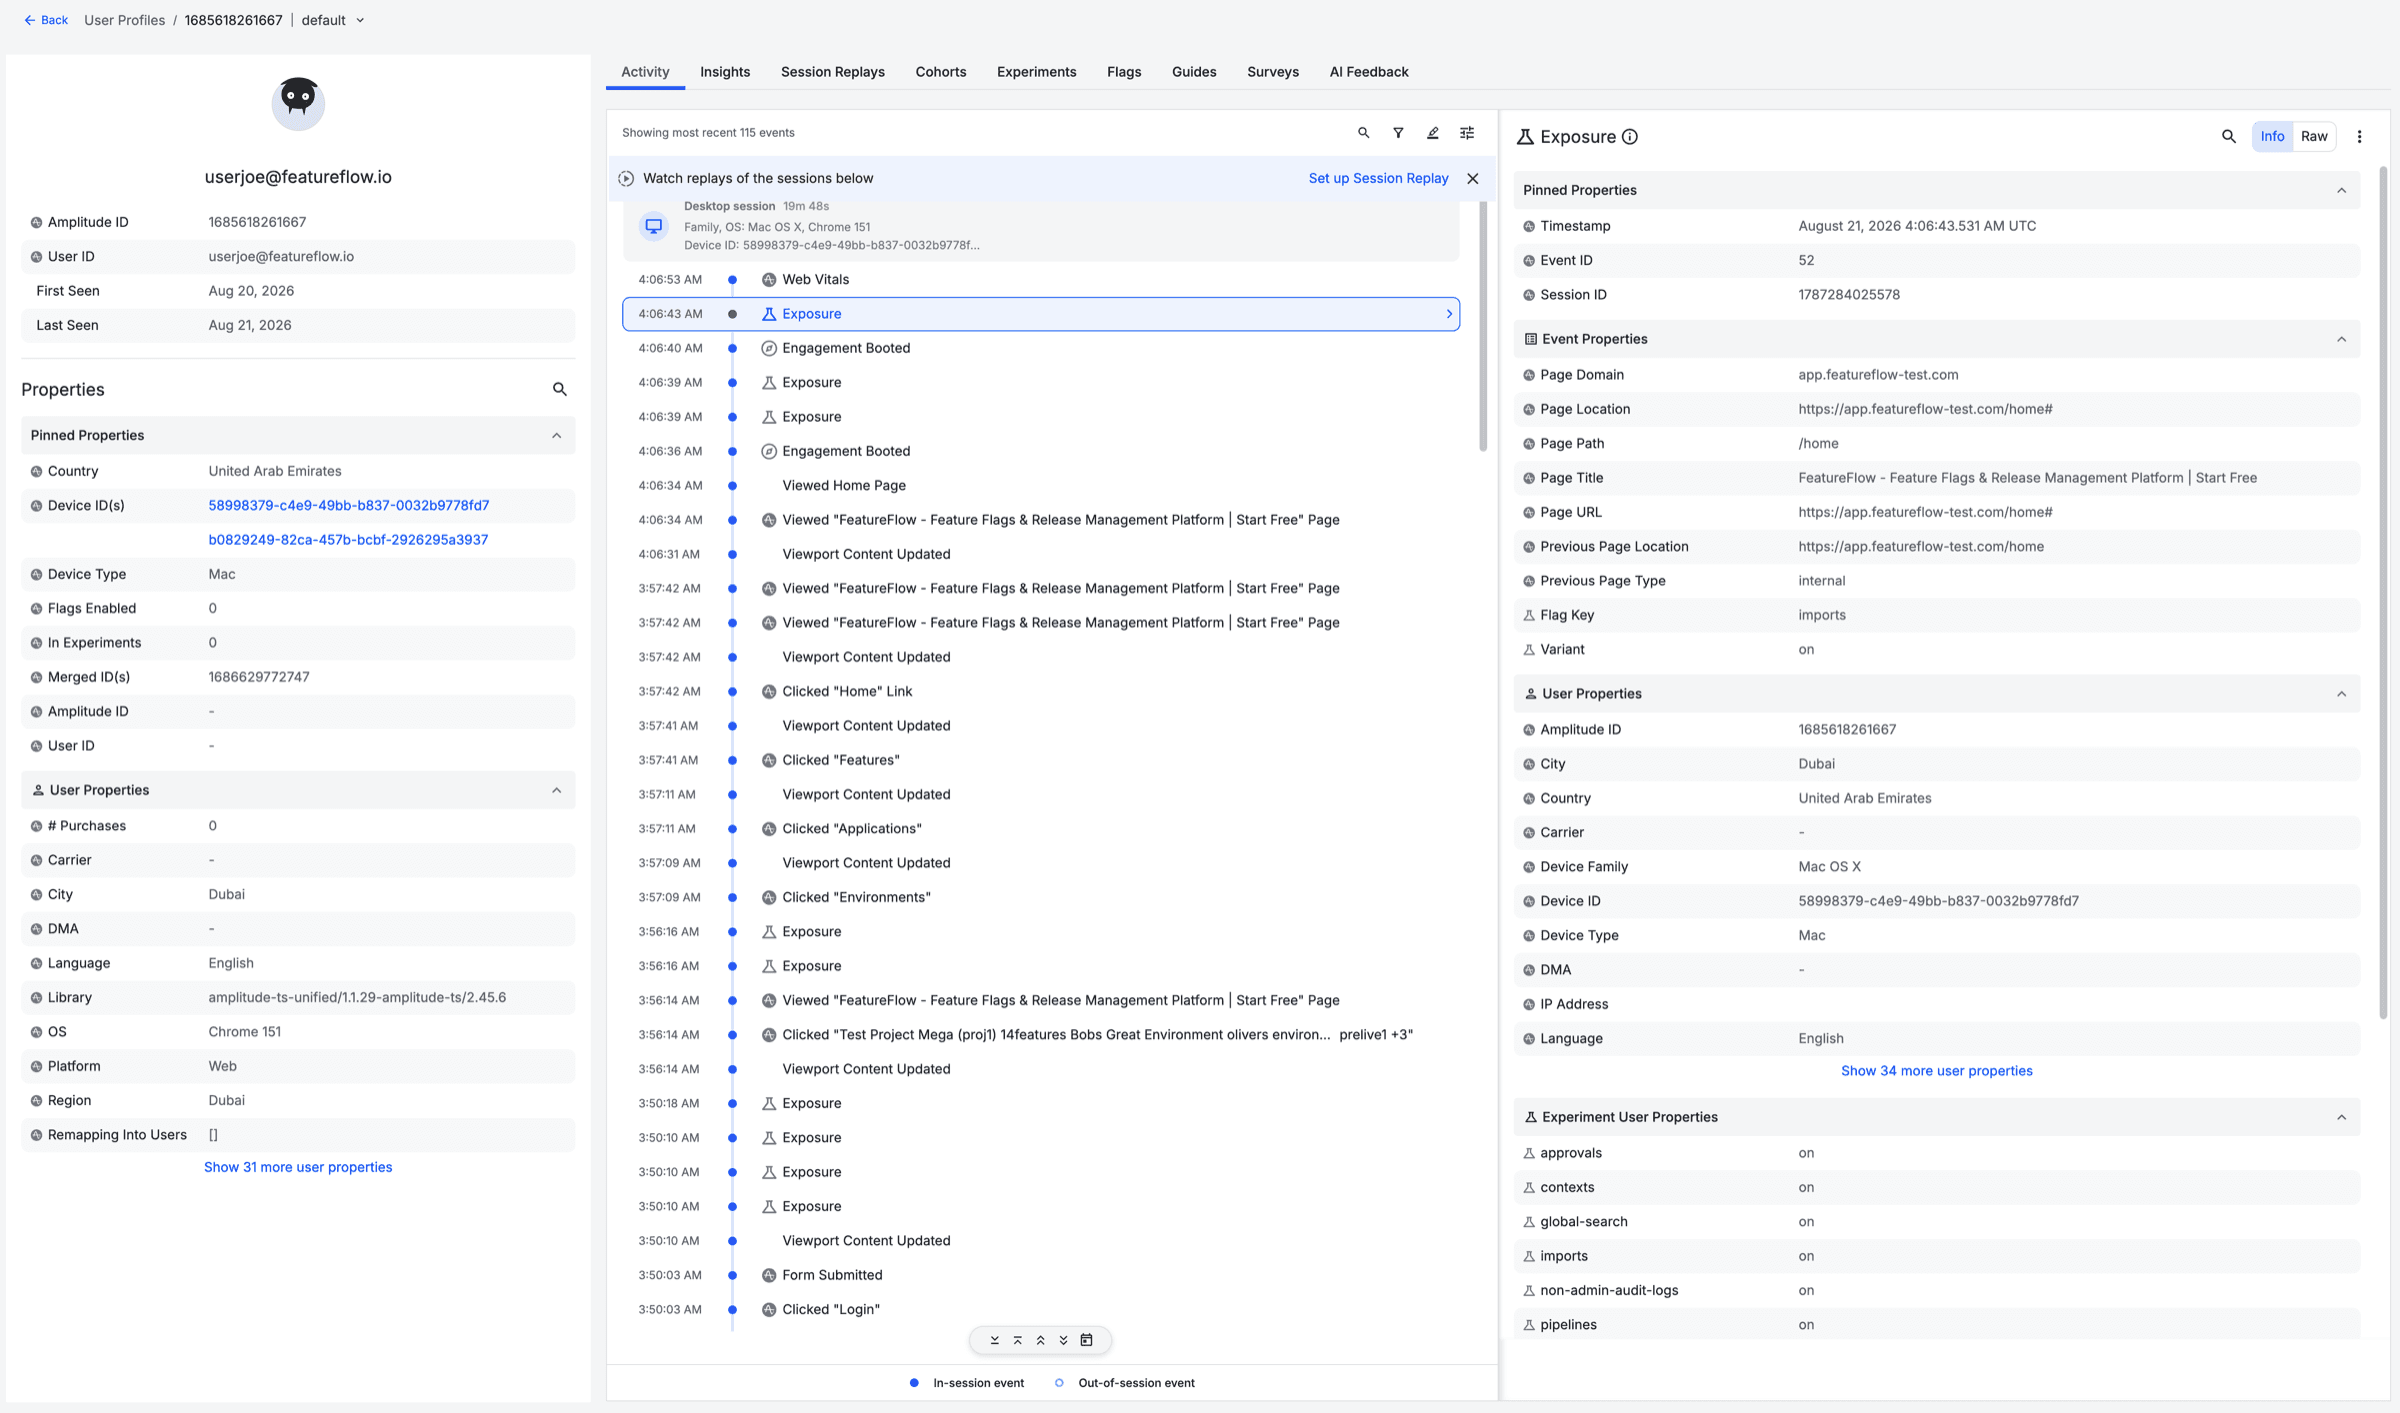
Your analytics tool already knows how to analyse an experiment — what it's missing is who saw which variant. The JavaScript SDK now sends flag exposures to Amplitude through your own Amplitude instance, so you can run A/B analysis in Amplitude Experiment without building or buying separate experimentation tooling.
One line of setup: pass amplitudeIntegration(amplitude) to the SDK's integrations config
Sends Amplitude's native $exposure event, so Experiment analysis works with no configuration
Sets a featureflow_<flagKey> user property — segment any chart by variant
Events ride your own Amplitude instance: your user identity, no id mapping, no data through third parties
Exposures deduped per user, flag and variant — evaluate() in a render loop won't inflate your event volume
Choose which flags send: an allowlist of keys, or a predicate for naming conventions like exp-*
Using another tool? A raw EVALUATION event lets you wire exposures to anything
Flag rollouts now appear as annotations on your Amplitude charts — so when you're investigating a drop in conversion, the moment the flag changed is already marked on the same axis you're looking at.
Annotations are global to the project — they appear on every chart, not just one
Grouped under a "Feature flags" category so they're easy to filter or hide
US and EU data residency supported
Optional environment filter — send production changes only, for example
A test-send button that reports exactly what Amplitude returned
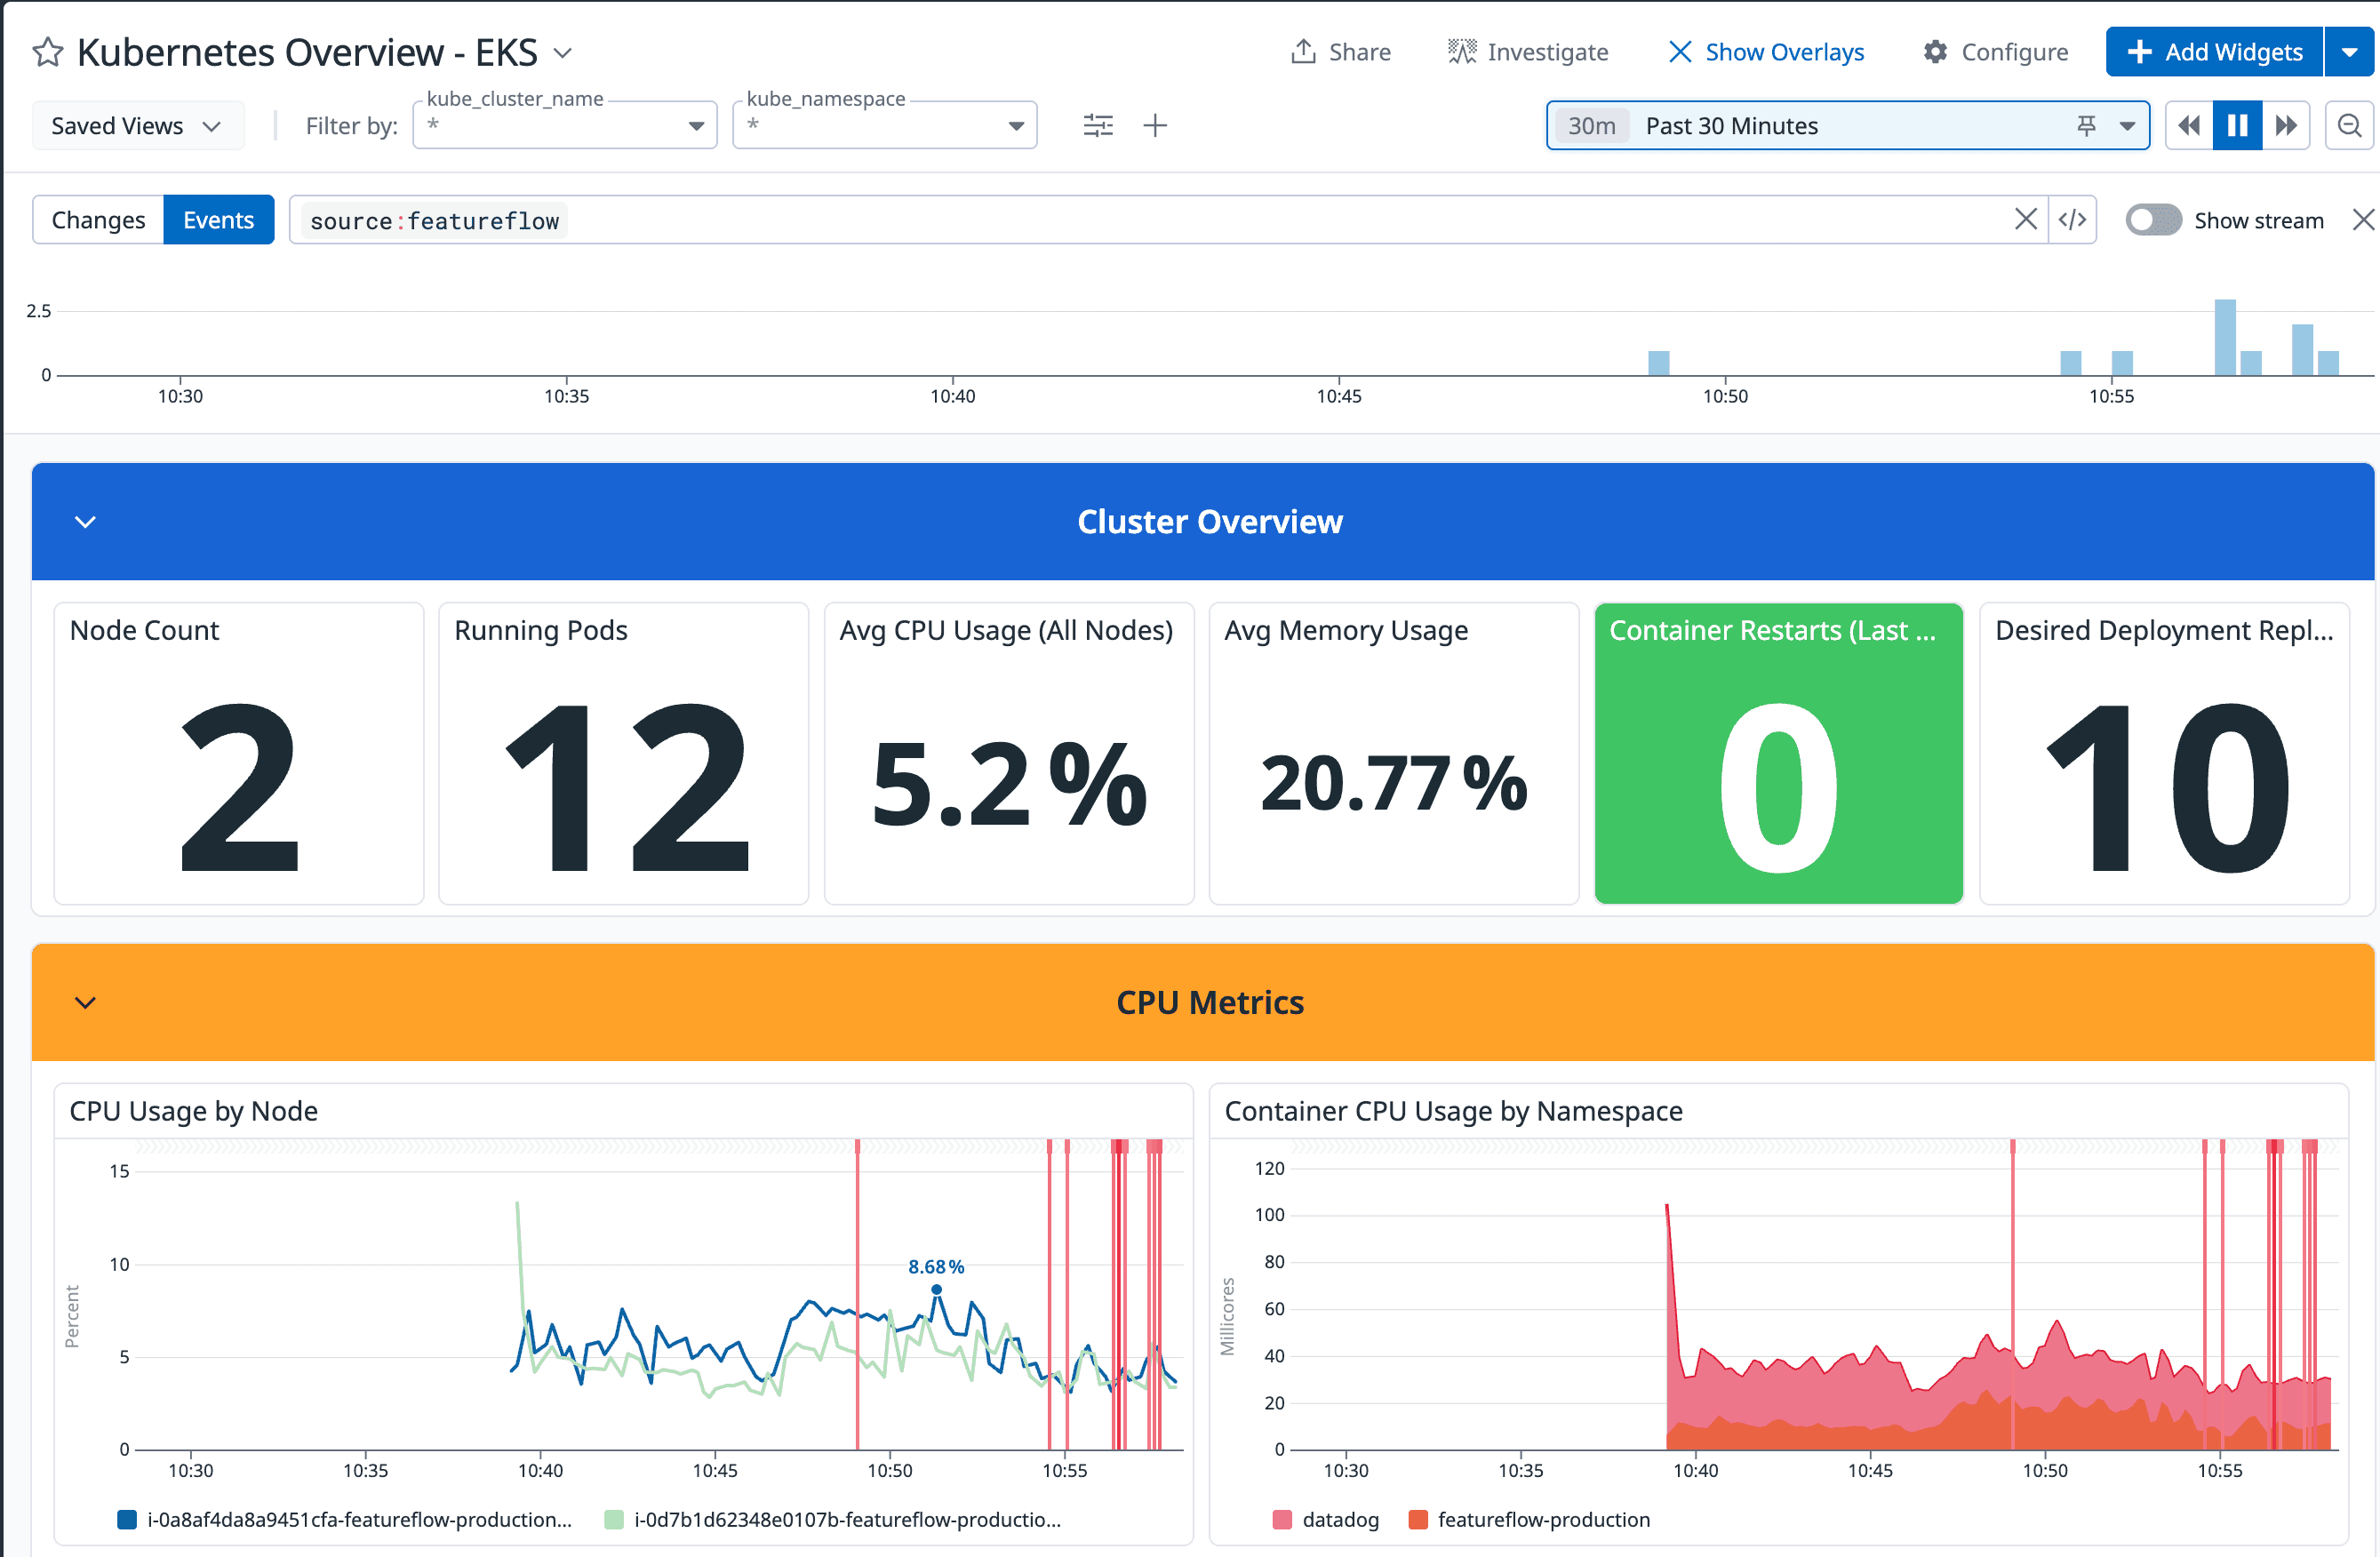
"Latency spiked at 14:32 — what changed?" is now answerable on the dashboard your team is already watching, instead of a separate trip to the Featureflow audit log. Flag changes can be pushed straight to Datadog, Grafana, or any URL as a signed webhook.
Datadog: flag changes appear as events in the stream and as overlays on your dashboards
Grafana: flag changes land as annotations
Any URL as an HMAC-signed webhook, for everything else
One destination list under Administration → Integrations, scoped per environment — production only, for example
A test-send button that reports back exactly what the destination said
Before you archive a flag, you want to know who would notice. Tag each SDK instance with an application name and every flag's statistics show exactly which applications are still evaluating it — so “is anything still using this?” has an answer you can act on.
An “Evaluated by” breakdown on each feature's statistics tab
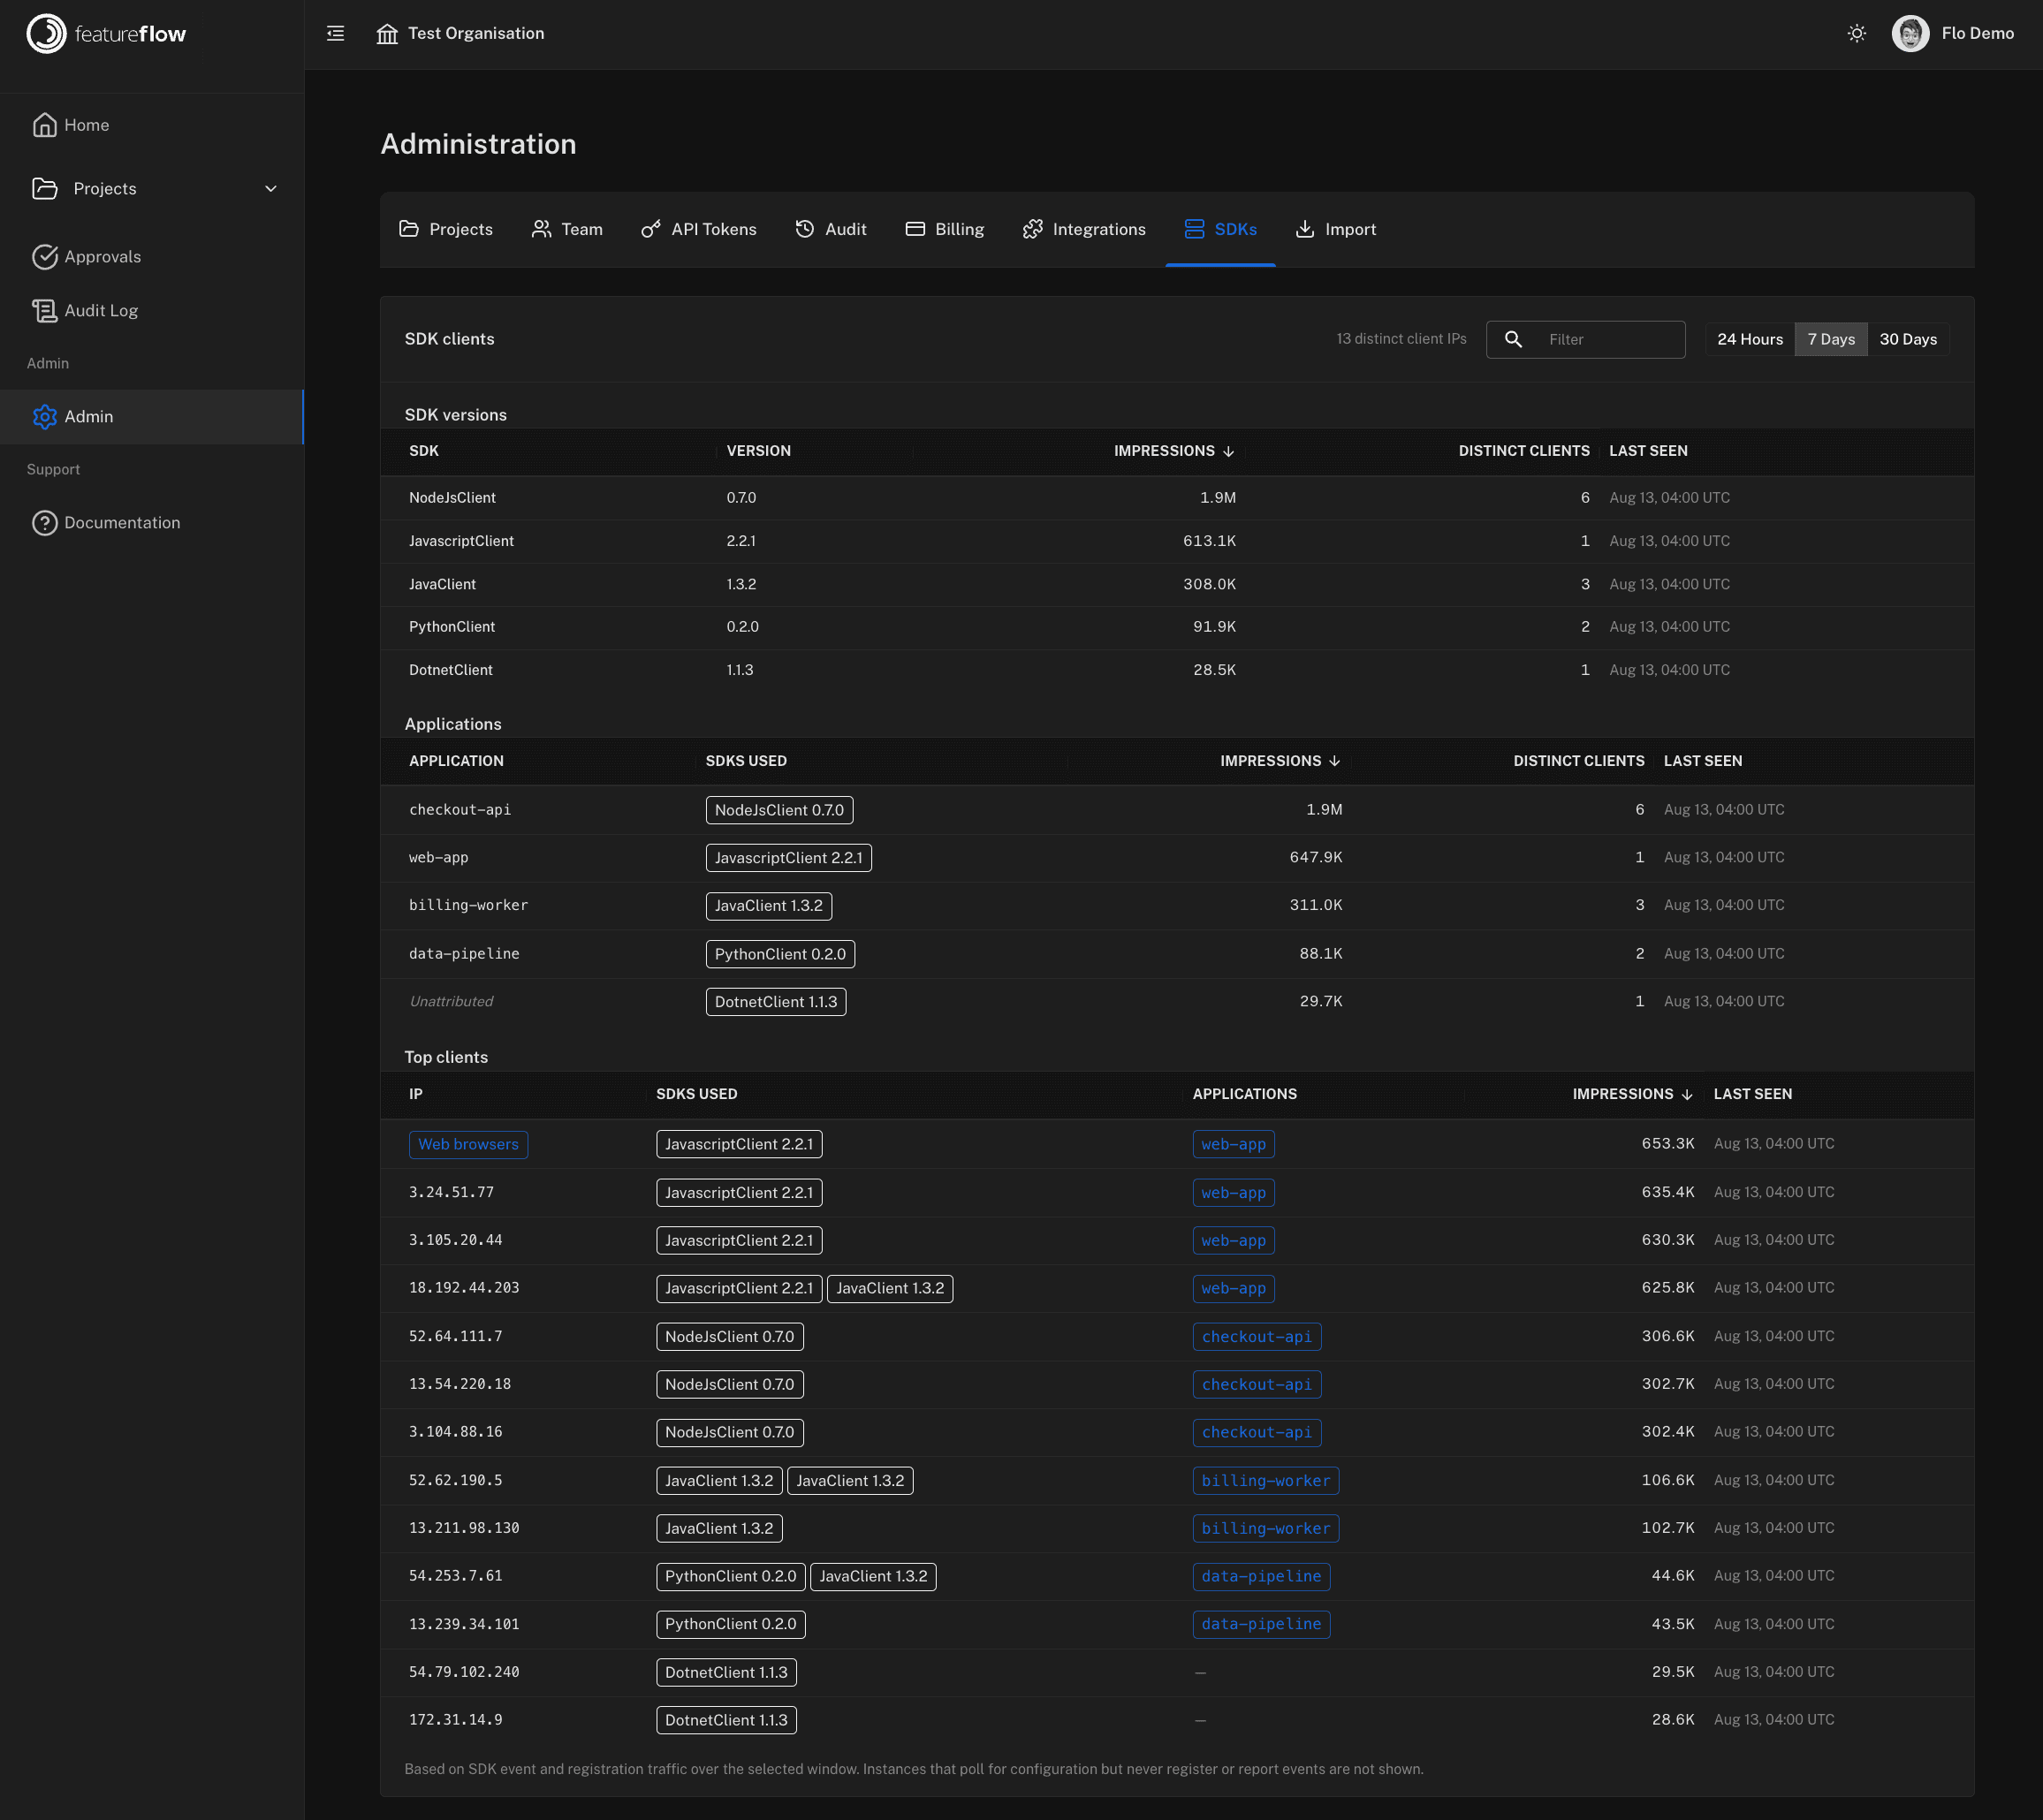
Applications listed alongside SDK versions and clients in the SDKs view
One config line in your SDK setup: give the instance an application name
The new SDKs view shows every SDK version, application and client that has talked to your account — with impressions, distinct clients and last-seen times over the past 24 hours, 7 days or 30 days. Old SDK versions still running in a forgotten corner of production now have nowhere to hide.
SDK versions ranked by traffic, so upgrades are a checklist, not a hunt
Top clients by IP, with the SDKs and applications each one runs
A usage run-rate projection and poll-interval what-if on the billing page, so your request volume is predictable before the invoice
A flag is now marked stale only when it has settled on one variant and gone unchanged past your project's stale window — finishing a rollout no longer flips a healthy flag to stale. A separate traffic signal shows when each flag was last evaluated, so cleaning up is a decision, not a gamble.
Stale window configurable per project (30 days by default)
Last-evaluated traffic status on every flag, independent of lifecycle state
Switching feature flag providers usually means recreating every flag by hand — which is exactly why nobody does it. The new importer connects to your LaunchDarkly account and brings your projects, environments, flags and segments across for you.